ARPANSA has prepared an updated interactive radon map of Australia that shows the average indoor radon levels for each census district based on measured values.
Based on modelling performed by the Australian Nuclear Science and Technology Organisation (ANSTO), ARPANSA also provides a radon potential map of Australia.
Introduction
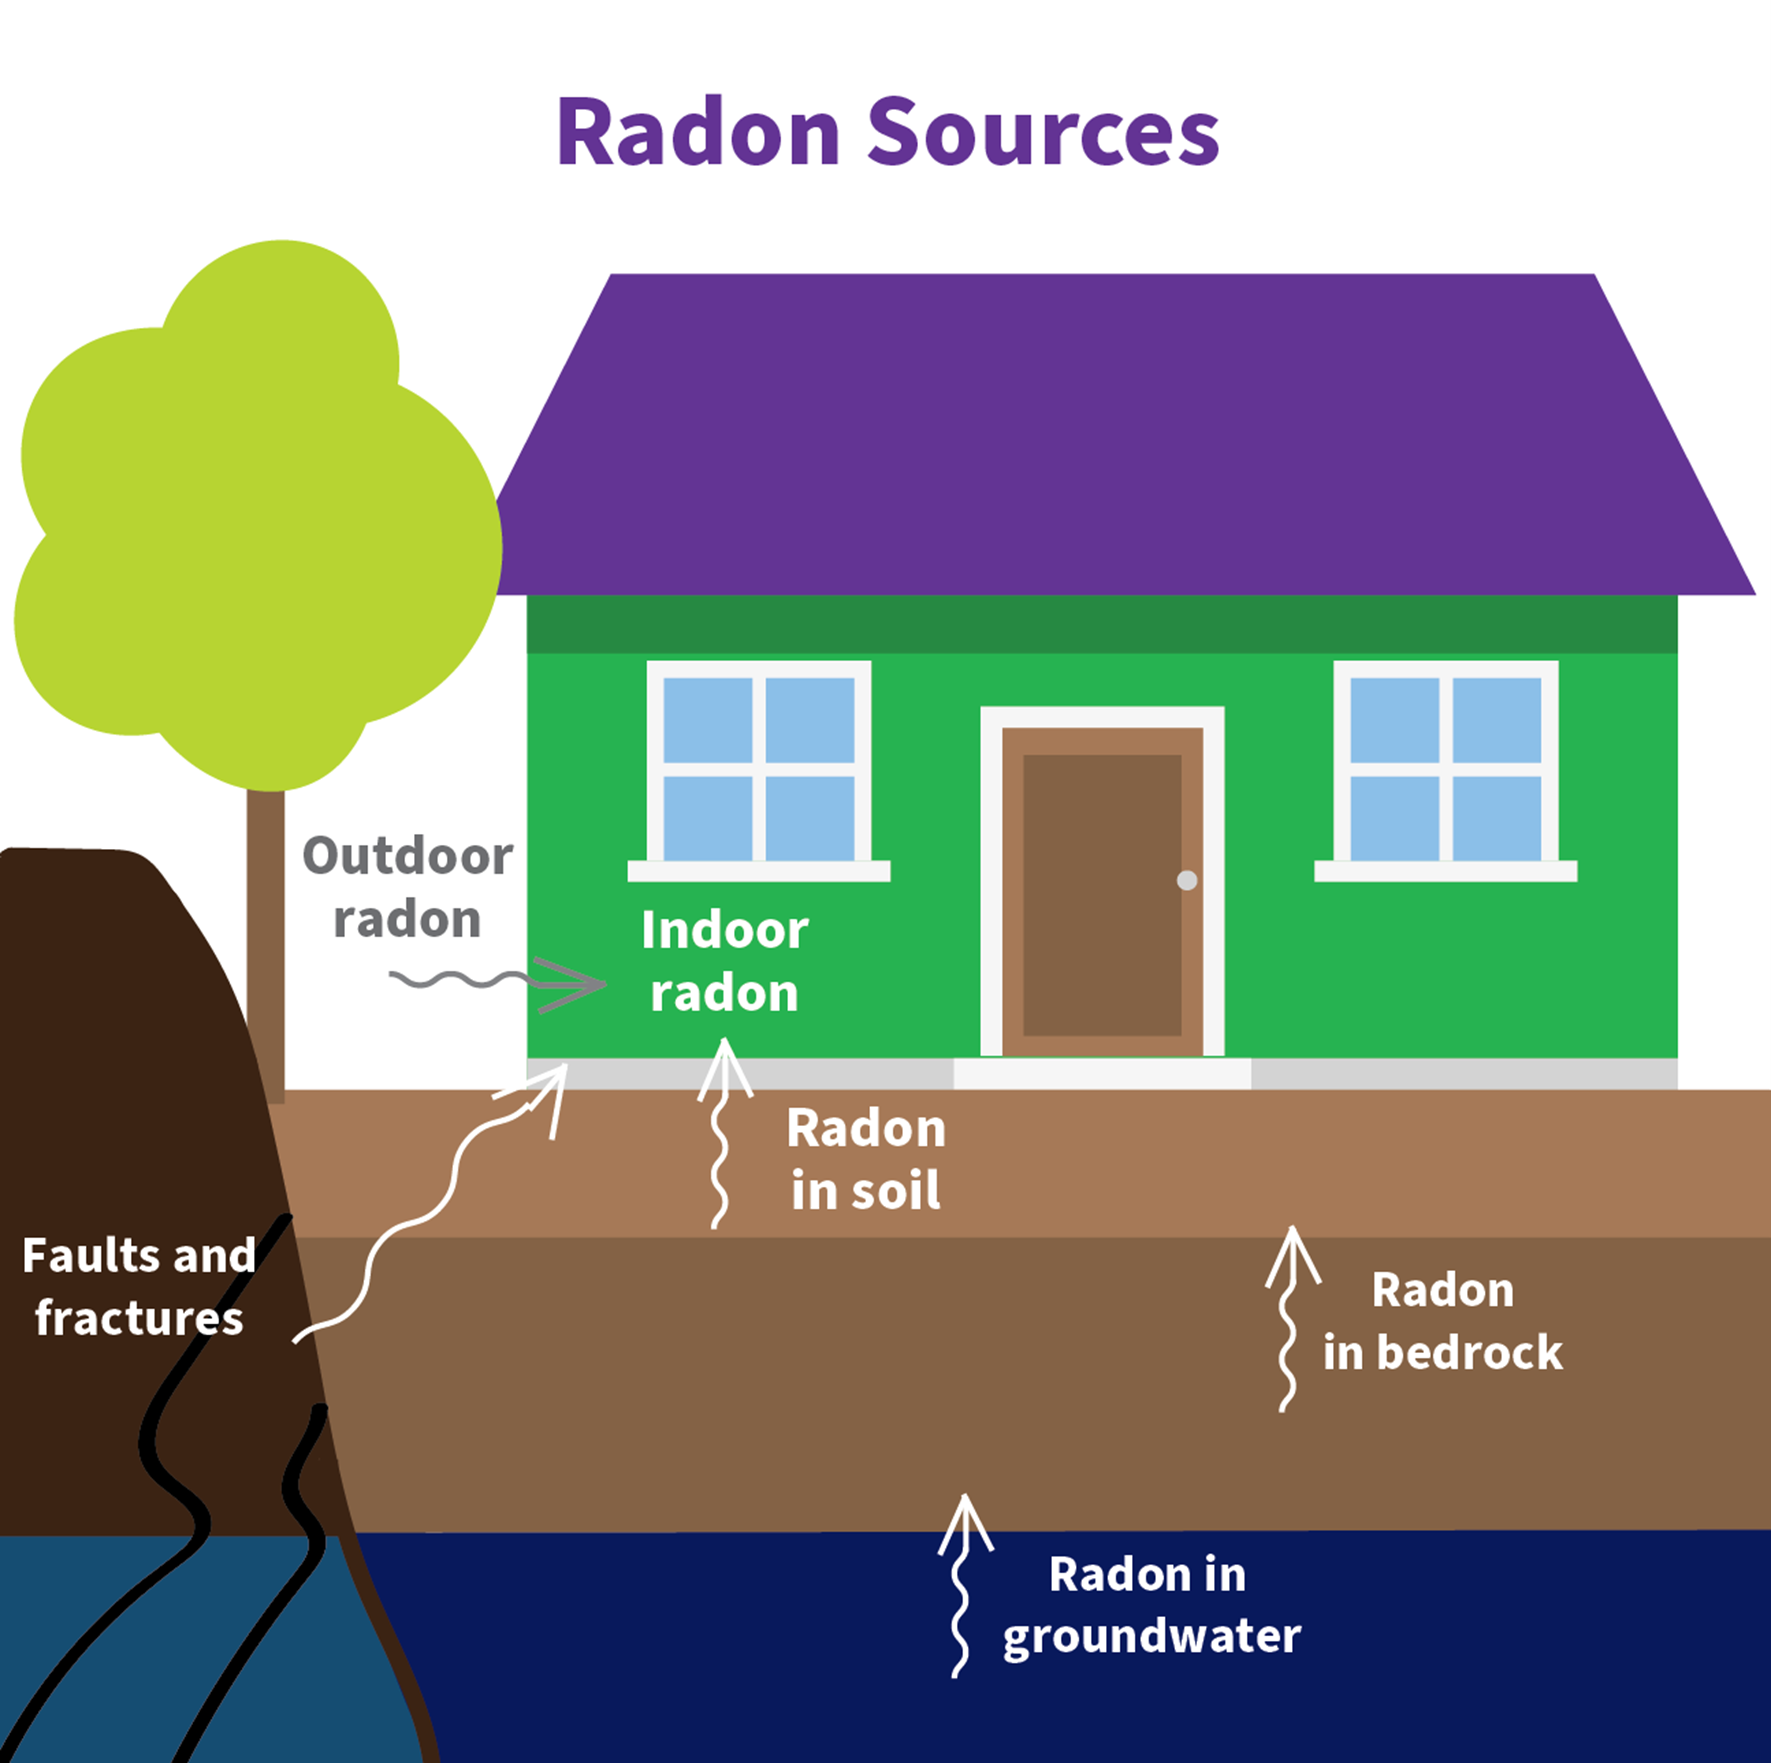
Radon is a naturally occurring radioactive gas that is produced from the decay of radium found in soil, rock, and water. It is colourless, odorless, tasteless, and chemically inert making it difficult to detect without specialised equipment. Radon can accumulate in buildings, particularly in areas with high radon potential, posing a health risk due to its association with lung cancer.
Understanding radon and its potential risks is crucial for maintaining public health. The indoor radon map and radon potential map for Australia enhances our ability to identify and mitigate radon exposure risks, contributing to a safer environment for all.
1990 Australian Radon Survey
In 1990, ARPANSA conducted a nationwide survey of more than 3300 Australian homes to determine the radiation dose to the Australian population from exposure to natural background radiation, including radon. Based on this survey, the average concentration of radon in Australian homes is about 10 Bq m⁻³. This is less than in many other countries and compares to a global average indoor value of 40 Bq m⁻³. Average radon levels in Australian homes are only a little larger than the radon levels in outside air and are of minimal concern tohealth.
The survey found a very wide range of radon levels across Australia. The results have been previously reported in the form of a radon map based on postcode districts. This map has now been updated to provide district averages of radon based on the SA2 regions from the 2011 census.
This interactive radon map displays interpolated values in census districts, for typical Australian homes. While factors such as house type, construction materials and ventilation can affect the radon levels, the effect of these factors is small relative to effects due to the local geology and soil type. Taking account of the house type, the actual radon levels in a particular home may be up to a factor of two different from that shown on the map.
The radon map shows that average radon levels in homes along the Great Dividing Range are typically higher than levels in homes on the coastal plan, mainly due to differences in the nature of the underlying geology (rock and soil).
Use your mouse cursor to zoom in on the area you would like to view, then left click on the region to show a pop-up box with the average radon level (see example).
Alternatively, use the search bar in the top right corner to directly search for an address or region.
The information provided in the interactive map can also be accessed via the CSV file below. Search and locate a suburb to find the average radon level.
Radon potential refers to the likelihood of radon gas released from the ground accumulating in buildings. The radon potential of an area is influenced by several factors, including the concentration of uranium and thorium in the soil, the soil's permeability, and the presence of geological features such as faults and fractures that can facilitate the movement of radon gas. High radon potential areas are those where the geological and environmental conditions are conducive to the release and accumulation of radon, posing a higher risk of indoor radon exposure. Assessing radon potential is crucial for identifying areas where radon mitigation measures may be necessary to protect public health.
In addition to the indoor radon map ARPANSA also provides a radon potential map of Australia. This map is based on work produced by ANSTO for Australia’s radon exhalation that is used in atmospheric modelling (Griffith et al., 2010.). This map is designed to provide a more comprehensive understanding of radon distribution and its potential impact on public health. The radon potential map is based on a combination of geological data, soil characteristics, and radon flux measurements. The map highlights areas with varying levels of radon potential.
The typical radon levels measured in Australian homes are low, this aligns with the modelled radon potential for Australia. For a particular house in a specific location, factors such as the local geology and house type could lead to different values. If you are concerned about the radon levels in your home, it is easy to have it tested. Radon meters can be hired via ARPANSA’s meter hire service.